Students Should Know When Statistics Are Misleading
Students Should Know When Statistics Are Misleading
Rethinking the Math Curriculum from Elementary Through High School
Push for Inquiry-Based Math
In the early 2000s, it was believed that students who relied on rules and repetitive practice in math learned to follow steps without understanding the math behind them. (National Research Council, 2001) Students might know how to “carry” or “borrow,” for example, but they might not know why those procedures worked. This lack of understanding was thought to lead to difficulty solving unfamiliar problems. (Lawson, 2007)
As a result, elementary teachers were encouraged to spend less time directly teaching math and more time guiding students as they worked through problems and discovered mathematical ideas for themselves. Rather than showing students how to solve a problem and then giving them opportunities to practise, teachers would have students solve open-ended problems, explain their thinking, and compare different solution strategies. (Small, 2009 & MacMath et al., 2009) The idea was that students would develop a deeper understanding of the math by working through the problems themselves.
Rule-based instruction was criticized. But rules were not abandoned altogether, they were introduced after students had developed their own strategies. The idea was that students would understand not only how the rules worked, but why they worked. (Lawson, 2007)
This is what I was taught in teacher’s college and I bought into it. It made sense.
Then, I got into the classroom and realized that what had sounded good in theory wasn’t working in practice. The approach was so time-consuming that it was difficult to cover all the specific expectations in the curriculum well. Students might develop a good understanding of some concepts, while others received too little attention.
I was using problems from Marian Small’s book at the time. A class could spend 60 minutes working through one open-ended problem, whereas showing students how to solve a problem and then giving them time to practise, while I circulated and helped, allowed us to cover much more. I ended up combining the two approaches.
Years later, I would discover that researchers had also questioned the effectiveness of a purely inquiry-based approach.
The New Elementary Curriculum
Like I have said in previous posts, Ontario’s scores on both PISA and EQAO have been declining. It was becoming clear that we needed to rethink how we were teaching math.
In 2020, the Ford government responded by introducing a new elementary math curriculum. It is often described as “back to basics,” but the government did not completely abandon inquiry-based learning. Instead, the new curriculum tried to find a better balance. Students would still be expected to understand the ideas presented, but there was a renewed emphasis on learning the basics too—including things like knowing their multiplication tables. (Correa, 2020)
The curriculum also expanded to include financial literacy, coding, and mathematical modelling. (Correa, 2020)
I think the new curriculum is a step in the right direction, but that doesn’t mean I think it’s perfect. There are still aspects of the curriculum that concern me—including the Social-Emotional Learning strand which focuses on helping students develop healthy mindsets, build resilience, and cope with stress while engaging with mathematics. I also believe teacher preparation and implementation remain significant challenges. I hope to discuss all those issues in future posts.
The Problem with High School Math
Students Need to Take Statistics
When are you ever going to use advanced functions? Engineers, physicists, mathematicians, and some computer scientists certainly do. But for most careers—and for everyday life—knowing how to make sense of numbers, graphs, and statistics is far more valuable.
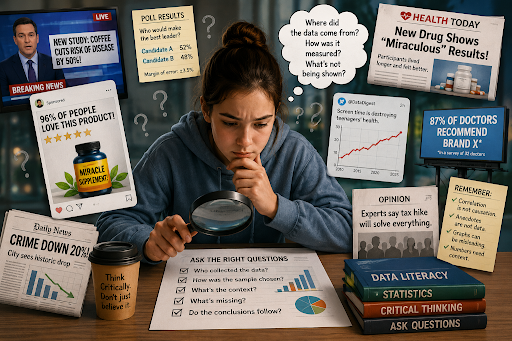
Understanding statistics has become an essential life skill—some researchers argue it’s as important as reading and writing. (Gigerenzer et al., 2009; Tarran, 2020) In today’s world, we are bombarded with statistics in news reports, advertising, scientific research, opinion polls, and health information. Unfortunately, we’re also bombarded with misinformation, misleading graphs, and statistics taken out of context. (Tarran, 2020; Johannssen et al., 2021) Every student should leave high school knowing how to look at the numbers and ask, “Do they actually support what I’m being told?” (Franklin, 2021)
It is important that today’s students be better at this than today’s adults, because when researchers gave a four-question graph-literacy test to adults in the United States and Germany, the average score was only about two out of four. (Okan et al., 2019) (The test is posted after the references of this blog post, so you can try it yourself.)
Other studies using different measures have found that even physicians, journalists, and politicians commonly misinterpret statistical information. (Gigerenzer et al., 2009) And these are the people we trust to make important decisions—the people we trust to give us accurate information!
Sadly, if you don’t understand statistics, you’re more likely to make poor decisions and more likely to be manipulated by people who manipulate numbers to convince you.
For example, a treatment might be advertised as cutting your risk by 50%, which sounds enormous. But if your risk only drops from 2 in 10,000 to 1 in 10,000, that same 50% suddenly means something quite different.
If you don’t know how to question the numbers you’re being shown, it’s much harder to spot misleading advertising, sensational news stories, conspiracy theories built around cherry-picked data, or misinformation disguised as science. (Gigerenzer et al., 2009; Johannssen et al., 2021)
Learning to Think Statistically
Statistics is a very different branch of mathematics. There isn’t always one right answer. Students have to become comfortable with uncertainty and learn that the same data can sometimes be interpreted in different ways. (Tarran, 2020) Students need more opportunities to practise this kind of thinking in elementary school, just as they spend years developing algebraic thinking.
In high school, the goal shouldn’t be to produce statisticians. It should be to produce informed skeptics—people who ask what the evidence shows and are willing to change their minds when the evidence doesn’t support what they believe.
Students should learn to question statistical claims: Where did the data come from? How were they analyzed? Do they actually support the conclusion being made? These are skills students will use for the rest of their lives—when making decisions about their health, their money, and even who to vote for. (Franklin, 2021)
For example, years ago, I gave Grade 12 students the following article: https://www.sciencejournalforkids.org/articles/can-we-smell-malaria/#open-article-popup
I assumed the students were too sharp to be misled by a simplified article, and I expected them to question it naturally. First they read it independently. Then, we read it together and picked it apart line by line using a set of guiding questions. When they first read the article on their own, they believed it wholeheartedly. By the time we finished going through it as a group, they were flabbergasted. They couldn’t believe how much they had missed—or how easily they had accepted what they were reading. They had simply never thought to read that critically before.
The Problem With the Current Curriculum
Ontario’s course, Statistics and Data Management, is a grade 12 course. It has a significant portion devoted to counting techniques, permutations, and combinations. These topics are great for students pursuing mathematics, actuarial science, or related fields. For certain students, they are actually pretty fun. But for the average citizen, they are far less useful than statistics. They can also make the course unnecessarily intimidating, discouraging some students from taking it in the first place—or causing others to drop it once they do.
What Should Change?
- Strengthen the Data strand in elementary school.
- Create dedicated Grade 11 and Grade 12 Statistics courses.
- Move combinatorics into a separate elective course.
- Make Grade 11 Statistics a graduation requirement.
- Universities should require statistics for more programs. Statistics should be an entrance requirement for fields such as the sciences, health sciences, psychology, economics, political science, and other disciplines that rely heavily on interpreting data.
- Change the way we (teachers and parents) advise students about mathematics. Functions are important, but they should no longer dominate the conversation. For most students, statistical literacy is likely to have a greater impact on their everyday lives.
Mathematics should prepare students for the world they actually live in. Every day they will encounter graphs, opinion polls, medical studies, election results, financial claims, and social media posts filled with statistics. They need to know when the numbers are being presented honestly—and when they’re being presented in a misleading way. Every day they will also face uncertainty. Should I invest my money here? Is this medication worth taking? Is this poll actually telling me who is likely to win an election? They need to know that statistics can tell us what is likely to happen, but not what will happen.
PS
After I finished writing this post, I received some special-issue magazines in the mail from the National Science Teaching Association. The topic? Data science.
They weren’t specifically about statistics, but much of the message was the same: students need to understand data because data is everywhere.
The guest editorial argues that understanding data and how data science shapes our world is becoming essential for students—not only for future jobs and innovation, but for being informed citizens. (Walker & Tofel-Grehl, 2026) Alan Baranovsky makes a similar argument for teaching data science before college. Students need to understand their own personal data, but they also need to recognize problems such as biased algorithms, misleading visualizations, and privacy breaches. (Baranovsky, 2026)
Douglas Allchin takes this a step further in an article about misinformation and science media literacy. He discusses how students can decide which scientific claims to believe and how the media can sometimes present an issue as controversial even when there is a strong consensus among the relevant experts. (Allchin, 2026a)
Allchin also looks back at eugenics as an example of what can happen when bad science is accepted as good science. In the early 1900s, eugenics appeared scientific and was used to justify policies such as restricting immigration. His point is that when power, profit, or privilege are involved, we need to look even more carefully at the evidence and at the motivations of the people making the claims. (Allchin, 2026b)
And really, that’s what this is all about: Realizing that students need to know how to look at data and evidence and decide whether they actually support what they’re being told.
Coming Soon:
- Every Parent and Teacher Should Read This Book: The Coddling of the American Mind
- A School Where I Would Love to Teach
References:
Allchin, D. (2026a). When experts disagree. The Science Teacher, 93(2), 8–12.
Allchin, D. (2026b). Charles Davenport & the prospects of genetics. The Science Teacher, 93(3), 14–19.
Baranovsky, A. (2026). Data science with a purpose: Designing and teaching an innovative interdisciplinary data science course. The Science Teacher, 93(1), 97–101.
Correa, P. (2020). 6 changes in Ontario’s not-so-basic new elementary math curriculum. The Conversation.
Franklin, C. (2021). As COVID makes clear, statistics education is a must. Significance, 18(2), 35. https://doi.org/10.1111/1740-9713.01509
Gigerenzer, G., Gaissmaier, W., Kurz-Milcke, E., Schwartz, L. M., & Woloshin, S. (2009, April 1). Knowing your chances: What health stats really mean. Scientific American Mind. https://doi.org/10.1038/scientificamericanmind0409-44
Johannssen, A., Chukhrova, N., Schmal, F., & Stabenow, K. (2021). Statistical literacy—Misuse of statistics and its consequences. Journal of Statistics and Data Science Education. https://doi.org/10.1080/10691898.2020.1860727
Lawson, A. (2007). Learning mathematics vs following “rules”: The value of student-generated methods. What Works? Research into Practice. Literacy and Numeracy Secretariat, Ontario Ministry of Education & Ontario Association of Deans of Education.
MacMath, S., Wallace, J., & Chi, X. (2009). Problem-based learning in mathematics: A tool for developing students’ conceptual knowledge. What Works? Research into Practice (No. 33). Ontario Ministry of Education, Literacy and Numeracy Secretariat & Ontario Association of Deans of Education. https://www.edu.gov.on.ca/eng/literacynumeracy/inspire/research/WW_ProblemBased.pdf
National Research Council. (2001). Adding it up: Helping children learn mathematics. National Academies Press. https://doi.org/10.17226/9822
Okan, Y., Janssen, E., Galesic, M., & Waters, E. A. (2019). Using the Short Graph Literacy Scale to predict precursors of health behavior change. Medical Decision Making, 39(3), 183–195. https://doi.org/10.1177/0272989X19829728
Small, Marian. Good Questions: Great Ways to Differentiate Mathematics Instruction. Teachers College Press, 2009.
Tarran, B. (2020). Statistical literacy for all! Significance, 17(1), 42–43. https://doi.org/10.1111/j.1740-9713.2020.01360.x
Walker, J. T., & Tofel-Grehl, C. (2026). Data science for science education: Exemplars for K–12 teaching and learning. The Science Teacher, 93(1), 6–7.
Other Sources:
Abedi, M., & Patton, J. (2018, May 10). Doug Ford says “discovery math” is hurting Ontario students’ grades. Should it be scrapped? Global News.
Durand, Marie-Anne, et al. “Graph Literacy Matters: Examining the Association between Graph Literacy, Health Literacy, and Numeracy in a Medicaid Eligible Population.” PLOS ONE, vol. 15, no. 11, 2020, article e0241844. Public Library of Science, https://doi.org/10.1371/journal.pone.0241844
Nature Research Intelligence. (2025). Statistical literacy and education practices. Nature Index. https://www.nature.com/nature-index/